This is my final idea, but im not sure how to display it! 😦
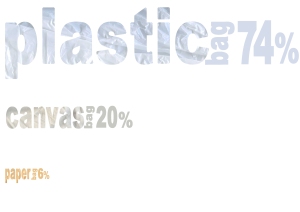
Just a thought, maybe instead of canvas should it say cotton?
This is my final idea, but im not sure how to display it! 😦

Just a thought, maybe instead of canvas should it say cotton?
Katie Kirk is a graphic designer and illustrator living and working in Minneapolis, Minnesota. With a love of vector art and patterns, Katie is always in the mood to scheme, collaborate and create. Together with her husband, Nathan Strandberg, they started EightHourDay, a multi-disciplinary, multi-talented design boutique.
Eli, No!, is a children’s book about the story of one trouble-making dog, and the one word that isn’t far behind.
This book is awesome, i love the simple imagery, the colours and the typography. 🙂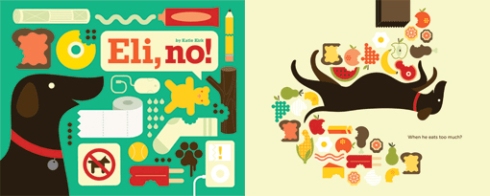
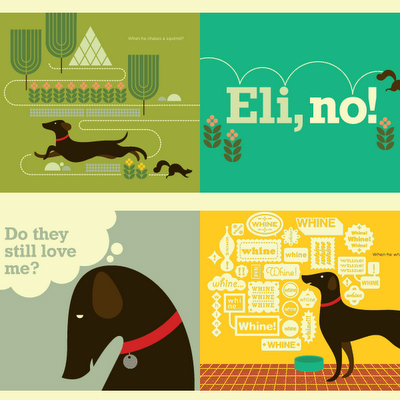
Here is some o her other work:

Edward Tufte is an American statistician and Professor of statistics, information design, interface design and political economy at Yale University. He has been described by The New York Times as the ‘Da Vinci of Data’. He is an expert in the presentation of informational graphics such as charts and diagrams, and is a fellow of the American Statistical Association. Tufte lives in Cheshire, Connecticut. He periodically travels around the United States to offer one-day workshops on data presentation and information graphics. Tufte has written several books, including visual Explanations, The visual Display of Quantitative Information, and Data Analysis for Politics and Policy. He writes, design, and self- publishes his books on analytical design, which have received more than 40 awards for content and design.
Examples of Tufte’s work:

This is a film about Global warming which shows Al Gore, former ‘next President’, going round the USA giving talks to people about global warming. Ok so this film was ok bit boring but very informative, to be honest it kind of scared me to see what we are doing to our own planet, the place we call ‘home’!. Al Gore said ‘Is it possible we should prepare against other threats besides terroists’ which i think is a really strong statement really says how dangerous global warming really is really puts it all into perspective!
I wish he got the presidentship rather than Bush, but hey hes gone now and hopefully Barrack Obama will be more like Gore in his ways on tackling climate change.
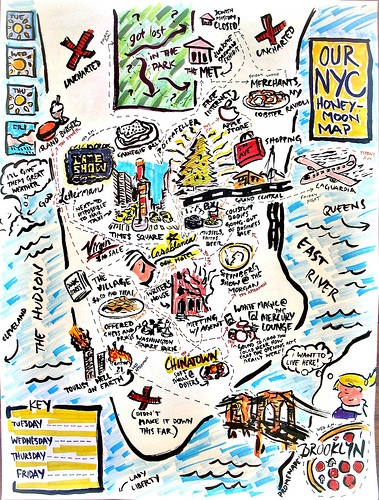
Adam asked us to note any ways of displaying data and been as this who film was about showing data there was thousands..
well here is a few of the ones i noted: